For Administrators
We deliberately focused initial development on directly benefitting end users. Giving them the ability to gather, manage, and share organized datain a way that is both simple and powerful.
But unless administrors and power users can easily create datasets themselves, they will be slowed down every time they need to bring in IT or external help.
Recent development work makes it much easier to create datasets.
In the example below a dataset of sales forecasts for different countries and products is consolidated into a simple summary for each country.

Let’s peek behind the scenes and see how easy that is to set up.
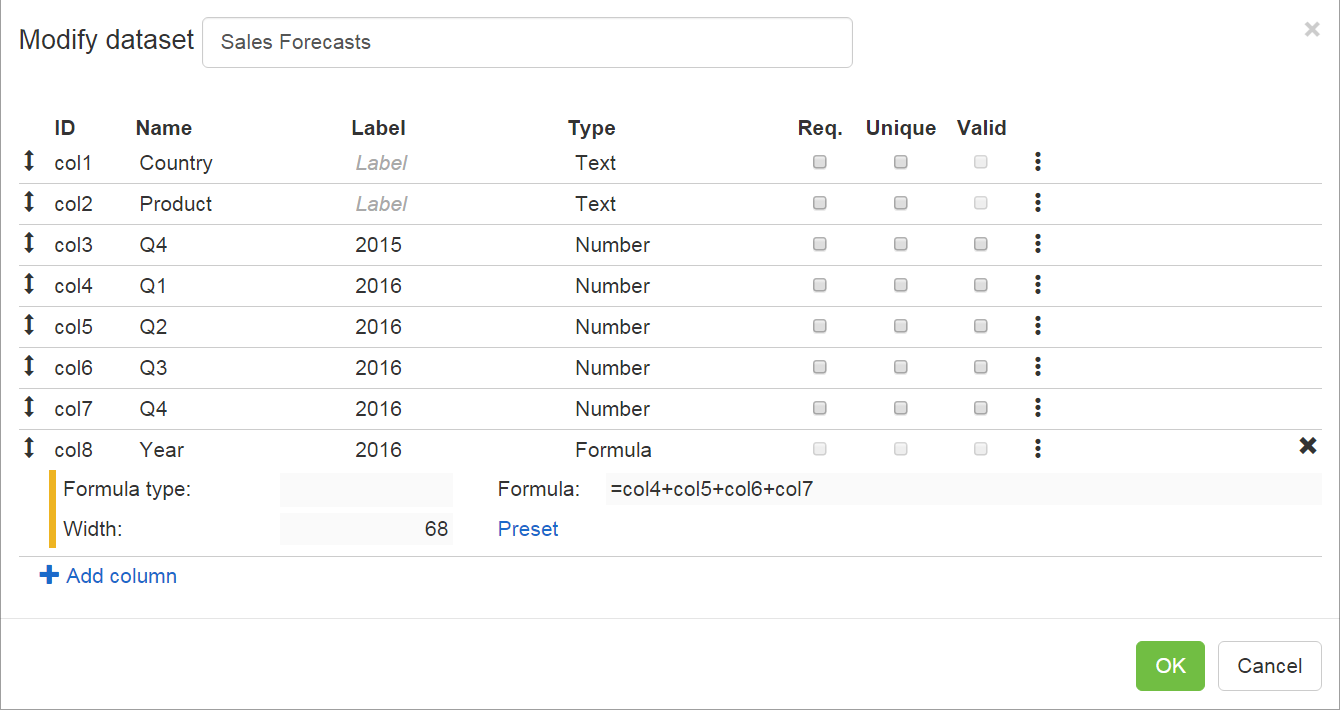
Here is the setup for the dataset where forecasts are entered. All we need is a very simple formula “=col4+col5+col6+col7” to add up Q1 to Q4 data to produce an annual total.
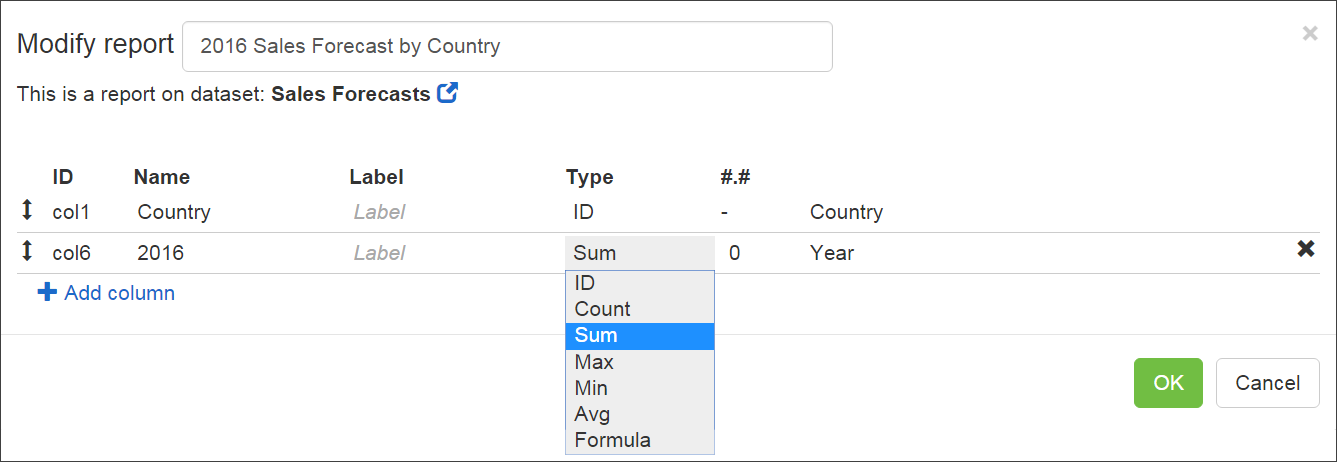
And the second dataset is created by selecting country as the first column (ID) and the calculated Year as the second column using Sum to aggregate the year data by Country.
Similar datasets could be created to show a summary by product, or a comparison between 2015 and 2016.
Aggregated dataset are just like any other datasets – the main difference is the numbers will be automatically recalculated in the background whenever the underlying data is changed.